
How to Analyze TikTok Creator Content
Review a creator’s loaded public videos with medians, coverage, posting frequency, duration, engagement composition, and a content-audit workflow.
On this page
Analyzing a creator’s content is different from analyzing a single video. A single video can be an outlier, a test, or a paid placement. A profile sample can show a pattern, but only within the cards you have loaded. The useful question is not “is this creator good?” It is “what does this loaded sample show about their content, and what remains unknown?”
TokGrid’s profile workflow is designed for that question. This guide covers the sample, the content and publishing view, and the limits worth stating in a creator brief.
Start with the profile sample
Open a public creator profile and let the page render. Scroll to load more cards, or use auto-load where available. Auto-load is best-effort: it can stop when no new cards appear, at a login wall or rate limit, or when the page changes.
Record the sample before interpreting it:
- The profile URL.
- The capture date.
- The approximate number of loaded videos.
- Any filters applied.
- Which metrics have valid coverage.
- Whether the sample includes reposts or liked videos, if the page exposes those tabs.
A profile is not a single population. Posts, reposts, and liked videos can mean different things. Be explicit about which tab you are reviewing.
Review medians and coverage
The Stats view gives you a baseline:
- Median views for the loaded sample.
- Median engagement rate for the loaded sample.
- Valid coverage for each metric.
- Top 10 by views, likes, saves, or engagement rate.
The median is useful for consistency questions. A creator with a median of 15,000 views and one 1 million-view outlier is not the same as a creator whose median is 800,000. Coverage tells you how many records actually support the median. If many records are missing an engagement field, the median rate may represent a smaller subset than the sample count suggests.
Read posting frequency correctly
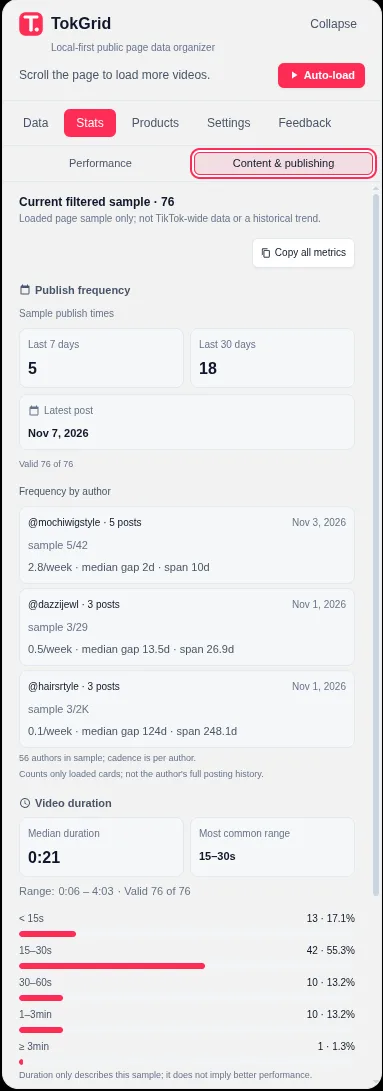
The content and publishing view can show posting frequency per author. TokGrid’s approach is deliberately conservative:
- Frequency is calculated per author, not merged across creators.
- It requires enough valid publish timestamps in the sample.
- It uses the time span between the loaded posts.
- It does not use the account’s total video count to infer a complete historical frequency.
This means a frequency figure describes the loaded sample, not the creator’s entire publishing calendar. A creator may have posted more often than the cards show. A sample with a short time span may produce an unstable weekly estimate.
Use frequency as context: “In this loaded sample, the creator’s posts were spaced about X days apart.” Avoid: “This creator posts exactly X times per week.”
Look at duration and engagement composition
The content and publishing view can also show:
- A duration distribution across fixed bins.
- The median and range of available durations.
- Engagement composition: how likes, comments, shares, and saves contribute to the sample’s total interactions.
Duration distribution is descriptive. A sample with many short videos does not prove that short videos perform better. It may simply reflect what the creator posts or what the page loaded first.
Engagement composition is also descriptive. A likes-heavy mix is not automatically worse than a saves-heavy mix. The mix can suggest how people respond, but it does not measure purchase intent, watch time, or audience quality.
Build a content audit
A creator content audit is easier to defend when it separates format observations from performance observations. A simple structure:
- Sample definition: profile, date, loaded count, tab type.
- Baseline: median views and engagement rate, with coverage.
- Consistency: how much the loaded videos vary around the median.
- Publishing: observed posting frequency and time span, with caveats.
- Format: duration distribution, recurring topics, hashtags, music.
- Commerce: product anchors and category patterns, if present.
- Outliers: the top loaded videos, with date, duration, and commerce context.
- Unknowns: full history, audience demographics, revenue, conversion.
This structure keeps the audit useful for a content team without turning it into a scorecard.
Use export for a repeatable review
On Pro, selected videos can be exported as CSV or JSON. A content audit can use a shortlist of the loaded videos with fields such as video ID, description, published time, duration, views, engagement fields, hashtags, and product context.
Keep the raw export with the audit. If you later change your interpretation, the source records are still available. The export does not merge other profiles or dates, so keep separate files for separate samples.
What creator analysis cannot tell you
TokGrid cannot tell you:
- The creator’s complete posting history.
- Their audience demographics or geography.
- Their revenue, sponsorship rates, or sales.
- Their conversion rate or customer acquisition cost.
- Whether a format caused a performance change.
- Whether their content will work for your audience.
- A creator rating or a “best creator” ranking.
It also cannot see private analytics. The analysis is built from public page data that the browser has loaded.
Common mistakes
- Treating the loaded profile as the full catalog. It is a sample.
- Comparing creators with different sample sizes. Report the size and date.
- Ignoring reposts or liked tabs. They are different populations.
- Using total video count as a frequency proxy. It is not a publishing schedule.
- Assuming duration causes performance. The distribution is descriptive.
- Equating engagement composition with sales. It is interaction, not revenue.
- Reading one outlier as a strategy. Check the date, format, and commerce context first.
A practical checklist
- ☐ Record the profile URL and capture date.
- ☐ State which tab was sampled.
- ☐ Report the loaded video count.
- ☐ Report median views and engagement rate with coverage.
- ☐ Note the observed posting frequency and time span.
- ☐ Describe the duration distribution.
- ☐ Describe the engagement composition.
- ☐ Review product anchors if present.
- ☐ List the top loaded outliers with context.
- ☐ State the unknowns clearly.
Where to go next
For a two- or three-creator comparison, read How to Research TikTok Competitors. For the underlying performance workflow, read How to Analyze TikTok Video Performance. For outlier selection, read How to Find High-Performing TikTok Videos. The TikTok Video Analytics feature page explains the content and publishing views.
A note on scope
This guide describes TokGrid’s behavior on public TikTok pages. Page data is processed locally; the extension does not promise complete account histories, platform-wide statistics, sales figures, or access to non-public content.