
How to Research TikTok Competitors
A public-page workflow for comparing competitor samples with medians, posting frequency, duration, engagement composition, and product anchors.
On this page
Competitor research on TikTok often starts with a screenshot and ends with a story. One competitor has a viral video, another has a consistent posting schedule, a third has product links everywhere. The screenshots are real, but the comparison is usually incomplete.
TokGrid cannot give you a complete competitor audit. It can give you a cleaner view of the public page sample you have loaded: a creator’s recent visible videos, a hashtag result set, or a search sample. This guide shows how to compare those samples without overclaiming.
Set the scope first
A useful competitor comparison starts with a scope statement:
- Which page types? Profile, search, hashtag, or video detail.
- Which creators or topics? Name them.
- What date was the sample captured?
- How many loaded videos are in each sample?
- Which filters were applied?
- Which fields are incomplete?
Without those answers, “competitor A is doing better” is not a finding. It is a comparison of two different page states.
TokGrid is designed for public pages. It does not log in, bypass access controls, or retrieve private analytics. It only sees cards the page has rendered. That limitation is the starting point for every conclusion.
Build a comparable sample for each competitor
For a creator comparison, open each public profile and load a similar amount of content. Scroll manually, or use auto-load on the profile page where available. Auto-load is best-effort and can stop when the page stops returning cards.
Aim for comparable sample definitions:
- Same page type.
- Similar capture window.
- Similar number of loaded videos, if possible.
- Same filter logic, such as “last 30 days” or “all loaded.”
- Same metric definition, especially for engagement rate.
If one profile has 200 loaded videos and another has 20, the medians are not equally stable. Report the sample size next to every comparison.
Compare medians before individual videos
The Stats view gives you a better comparison baseline than a single viral video:
- Median views: the middle of the loaded sample.
- Median engagement rate: the middle interaction efficiency of the loaded sample.
- Valid coverage: how many records contributed to each median.
- Top 10: the upper tail of the sample, not the whole distribution.
A competitor with one 2 million-view video and a median of 4,000 is different from a competitor with a median of 80,000 and no giant outlier. The median and the top of the distribution tell different stories.
Look at posting frequency and duration
The content and publishing view can show:
- Posting frequency per author, when the sample has enough valid publish timestamps.
- The interval between posts.
- A duration distribution across fixed bins.
- Engagement composition across likes, comments, shares, and saves.
These are descriptions of the loaded sample. They are not a complete publishing calendar. A creator may post more often than the loaded cards show. A duration distribution may be skewed by which videos the page rendered first.
Use frequency and duration as context, not as a scorecard:
- A high posting frequency is not automatically good.
- A longer video is not automatically more engaging.
- A likes-heavy composition is not automatically better than a saves-heavy one.
- A missing timestamp excludes a record from frequency calculations.
Add product context carefully
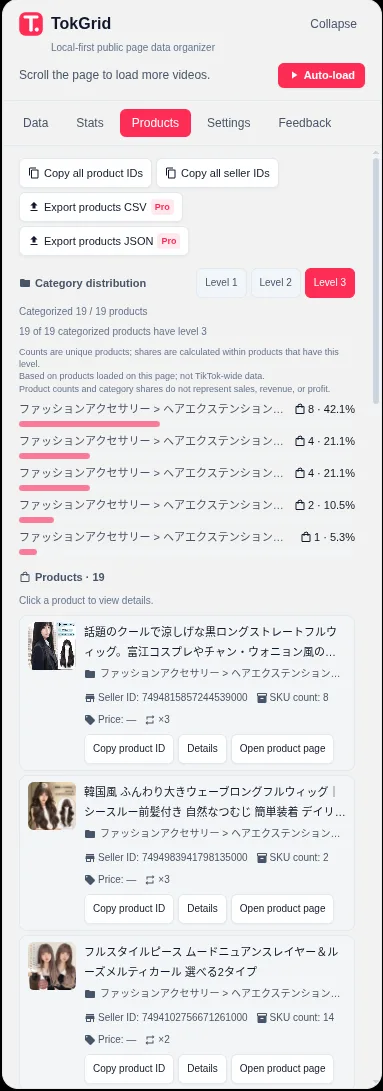
If the videos expose product anchors, the Products tab can show:
- Product titles.
- Three-level category paths.
- Seller IDs.
- SKU counts.
- Product IDs and SEO links.
- A deduplicated product list and category distribution.
This is useful for understanding what a competitor is attaching to content. It is not a sales report. TokGrid does not estimate units sold, revenue, advertising spend, or conversion. A product appearing in many videos is a content pattern, not proof of commercial success.
Take notes you can defend
A competitor research note should separate observations from interpretations.
Observation: “In the loaded profile sample of 48 videos, median views were 12,400 and median engagement rate was 4.1%, with 39 valid engagement-rate records.”
Interpretation: “This creator’s loaded sample has a consistent mid-range reach, but the sample does not show whether that reach converts to sales.”
That separation keeps the note useful. It also makes it easier to update when the sample changes.
If you need a file for further work, Pro can export the selected videos as CSV or JSON. Keep the page URL, capture date, filters, and sample size with the export. The export contains the selected records; it does not merge other pages.
What competitor research cannot tell you
TokGrid cannot tell you:
- A competitor’s full content history.
- Their revenue, sales, or ad spend.
- Their audience demographics.
- Their conversion rate or customer acquisition cost.
- Whether a viral video was profitable.
- Whether their strategy will work for you.
- A creator rating or a cross-creator “best” ranking.
It also cannot compare creators across pages automatically. You build a sample per page and compare the summaries yourself.
A practical comparison workflow
- Choose two or three competitors with comparable page types.
- Capture each profile sample on the same day, if possible.
- Record sample size and valid coverage.
- Compare median views and median engagement rate.
- Compare posting frequency and duration distribution.
- Compare engagement composition.
- Review product anchors and category patterns.
- Note outliers and check their dates, duration, and commerce status.
- Export a shortlist on Pro if you need to review it later.
- Write the limits next to the findings.
Ethics and platform rules
Competitor research should use public content and respect platform terms. Do not republish a competitor’s video or claim their content as your own. Do not use the data to harass, spam, or automate outreach. TokGrid does not provide automated messaging or contact workflows.
Also be careful with framing. “This creator’s loaded sample suggests a consistent format” is a defensible observation. “This creator is successful because of this format” is a causal claim the data cannot support.
Where to go next
For a creator-specific workflow, read How to Analyze TikTok Creator Content. For product context, read How to Find TikTok Products by Category. For the underlying performance workflow, read How to Analyze TikTok Video Performance. The TikTok Video Analytics feature page explains the available comparison controls.
A note on scope
This guide describes TokGrid’s behavior on public TikTok pages. Page data is processed locally; the extension does not promise complete account histories, platform-wide statistics, sales figures, or access to non-public content.