
How to Analyze TikTok Video Performance
A practical workflow for reviewing the public TikTok videos already loaded on a page, using filters, medians, coverage, and limits you can explain.
On this page
TikTok video performance is easy to describe badly. A creator can point to one high-view video, a seller can point to one low-view product clip, and both can sound convincing. The useful question is narrower: what does the sample in front of you show, and what can you responsibly conclude from it?
TokGrid is built for that narrower question. It organizes the public videos already rendered on a TikTok page into a list you can filter, sort, and inspect. This guide walks through a repeatable workflow and the limits you should mention whenever you share the result.
What “performance” means on a page sample
Performance is not one number. Depending on the question, it can mean:
- Reach: views.
- Response: likes, comments, shares, and saves.
- Efficiency: engagement rate, calculated from the available counts and views.
- Consistency: how a creator’s loaded videos compare with one another.
- Context: publication date, duration, commerce status, and product anchors.
TokGrid can expose these fields when the page makes them available. It cannot invent a metric that the page does not contain. A video with no view count is not a video with zero views; it is a record with a missing value.
Step 1: Open a supported public page
TokGrid is designed for public TikTok pages you can open without logging in. The supported page types are:
- Home, For You, and Following.
- Video detail pages.
- Hashtag pages.
- Search results.
- User profiles.
- Explore.
- Music detail video lists.
Open the page that matches your question. A search result is useful for a topic sample. A creator profile is useful for comparing that creator’s loaded videos. A hashtag page is useful for seeing which content is attached to a challenge or theme. Do not expect the same sample from each page type.
Step 2: Build a sample you can describe
TokGrid only processes cards that are already rendered. Scroll the page to load more, or use auto-load on a supported list page. Auto-load asks the page to load its own cards by scrolling through the viewport. It can help, but it is best-effort:
- It may stop when the page stops returning new cards.
- It may stop at a login wall or rate limit.
- It may stop when the page changes, the tab is hidden, a dialog opens, or a cap is reached.
- It increases page network and resource usage.
Before you interpret anything, write down the sample definition. For example: “Public search results for [topic], loaded on [date], filtered to the last 30 days, first 60 rendered cards.” That sentence is more useful than “TikTok performance” because it tells the reader what was actually measured.
Step 3: Filter and sort before comparing
A raw list mixes different questions. Filtering makes the comparison more honest. TokGrid supports:
- Numeric ranges for views, likes, comments, saves, and engagement rate.
- Published date and video duration ranges.
- Media type: all, commerce, ad, or organic.
- Keyword include or exclude on the description and hashtags.
- Product category paths when product data exists.
- Quick actions for high engagement, the last seven days, and commerce-first.
Sorting is a separate decision. You can sort by views, likes, comments, shares, saves, engagement rate, published time, or duration. Sorting changes the order of the list, not the underlying sample. If you sort by views, you are looking at reach; if you sort by engagement rate, you are looking at efficiency. Do not treat one as a substitute for the other.
Step 4: Read the Stats tab
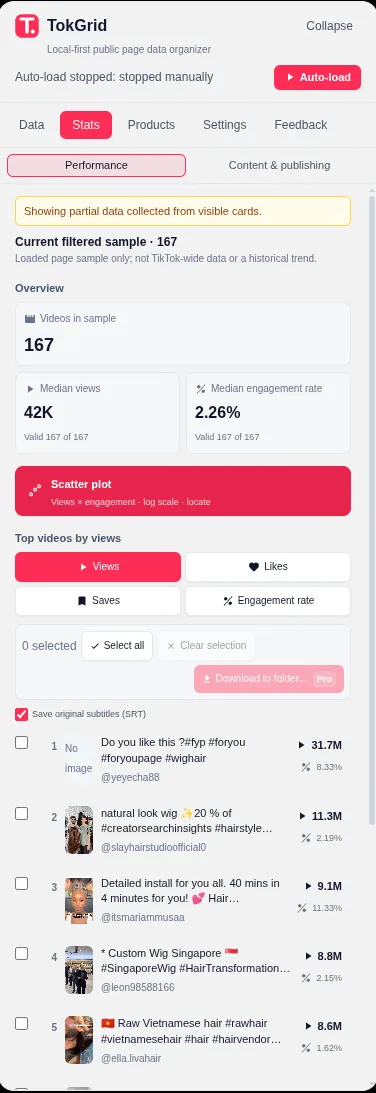
The Stats tab is where the sample becomes explainable. TokGrid shows:
- The number of videos in the current filtered sample.
- Median views and median engagement rate.
- Valid coverage counts, such as how many records have a usable value for a metric.
- Top 10 rankings by views, likes, saves, or engagement rate.
- A views-by-engagement scatter for records with both values.
- Publishing frequency, duration distribution, and engagement composition for the content and publishing view.
The median is useful because one extreme video can move an average dramatically. Coverage is useful because a median based on 12 videos is not the same as a median based on 120. If the panel says the median is based on a small valid subset, say so.
The scatter view is a diagnostic, not a promise. A point in the upper-right area means “high views and high engagement within this sample.” It does not mean the video sold products, changed an audience’s opinion, or will perform the same way again.
A worked engagement rate example
Engagement rate is a calculation, not a field that TikTok necessarily publishes. TokGrid uses the available fields:
engagement rate = (likes + comments + shares + saves) / views × 100
For example, a video with 20,000 views and 1,200 combined interactions has a 6% engagement rate. If the same video had 2,000 views instead, the rate would be 60%, which is a very different claim. The formula is simple; the interpretation is where mistakes happen.
TokGrid shows no rate when views are zero or missing. Missing metric values are excluded from medians and rankings rather than treated as zero. That choice matters: treating a missing view count as zero would create a misleading rate. Interaction counters are handled separately in the engagement-rate formula.
Common interpretation mistakes
- Comparing different page types without saying so. A profile sample and a search sample are different populations.
- Using one video as a creator-level conclusion. One outlier is a data point, not a trend.
- Treating a page snapshot as live data. Metrics reflect when the page was read. They are not continuously refreshed.
- Ignoring coverage. A median based on 10 valid records is weaker than one based on 100.
- Equating engagement with sales. Engagement describes interaction, not revenue or purchase intent.
- Using “all videos” language. The extension only sees rendered cards and does not promise a complete history.
What this workflow cannot tell you
TokGrid does not provide platform-wide statistics, historical growth curves, sales estimates, revenue estimates, audience demographics, or a complete creator history. It does not merge data across pages or tabs. It does not predict virality. Those are not small caveats; they define the kind of question the tool can answer.
If your team needs a platform-wide benchmark, a historical trend, or a sales estimate, TokGrid is not that source. If your team needs a clean, explainable sample from a public page, it can be useful.
A practical checklist
- ☐ State the page type and URL.
- ☐ Record the capture date.
- ☐ Describe the filters used.
- ☐ Report the sample size.
- ☐ Report median values with coverage.
- ☐ Separate reach findings from engagement findings.
- ☐ Note missing fields.
- ☐ Avoid sales, revenue, and virality claims.
- ☐ Keep the raw list or export with the summary.
Where to go next
If you want the calculation itself, read How to Calculate TikTok Engagement Rate. To inspect a filtered list without losing its context, read How to Preview, Sort, and Filter TikTok Videos. If you want to find the outliers in a sample, read How to Find High-Performing TikTok Videos. The TikTok Video Analytics feature page explains the available controls, and the Privacy Policy explains how page data is handled.
The goal is not to make a page look impressive. It is to make a page sample understandable enough that someone else could review the same evidence and reach a similar conclusion.
A note on scope
This guide describes TokGrid’s behavior on public TikTok pages. Page data is processed locally; the extension does not promise complete account histories, platform-wide statistics, sales figures, or access to non-public content.