
How to Find High-Performing TikTok Videos
Use the loaded page sample, quick filters, rankings, and the views-by-engagement scatter to find outliers without overstating what they mean.
On this page
“Find the high-performing videos” sounds like a search query. In practice, it is three decisions: what counts as performance, which page you are sampling, and how much of that page has actually loaded. Skip those decisions and the list may look impressive while answering nothing in particular.
This guide shows a repeatable way to find outliers in a public TikTok page sample with TokGrid, then check whether the outlier is worth acting on.
Define “high-performing” before you sort
A video can be high-performing in several different ways:
- High reach: many views.
- High interaction efficiency: a high engagement rate relative to views.
- High absolute interaction: many likes, comments, shares, or saves.
- High relevance: strong product or topic fit, even if the raw numbers are modest.
- High consistency: part of a creator’s repeatable pattern rather than a one-off.
The right definition depends on your job. A seller looking for product demand may care about reach plus product anchors. A creator studying format may care about engagement plus duration and topic. A competitor researcher may care about consistency across a profile’s loaded videos.
Write the definition down before you sort. “High views” and “high engagement rate” produce different lists, and neither is automatically better.
Step 1: Choose the page type that matches the question
TokGrid supports public Home, For You, Following, video detail, hashtag, search, profile, Explore, and music-list pages.
- Use search results for a topic or keyword sample.
- Use a hashtag page for a challenge or theme sample.
- Use a profile for one creator’s loaded videos.
- Use Explore or a music list for discovery-oriented samples.
- Use a video detail page when you want the current video’s context rather than a list.
The page type changes the population. A hashtag sample and a profile sample are not interchangeable, even if they contain some of the same videos.
Step 2: Load enough of the sample to be useful
Scroll the page to render more cards. On supported list pages, auto-load can ask the page to load more by scrolling through the viewport. It is deliberately best-effort:
- It stops when no new cards appear.
- It stops at login walls, rate limits, page changes, hidden tabs, and dialogs.
- It has attempt, time, and item caps.
- It does not promise a complete list.
Before ranking anything, check the sample size. A Top 10 from 15 loaded videos is a very different finding from a Top 10 from 150. TokGrid shows the sample count in the Stats view.
Step 3: Use quick filters to narrow the question
The quick actions are useful starting points:
- High engagement: surfaces videos with stronger interaction efficiency.
- Last 7 days: limits the sample to recent published dates.
- Commerce first: keeps the sample but prioritizes videos with commerce signals.
These are shortcuts, not conclusions. “High engagement” still depends on the formula and the available fields. “Last 7 days” still depends on valid published timestamps. “Commerce first” changes the order; it does not prove that a video is selling products.
For more control, use numeric ranges and filters:
- Views, likes, comments, saves, and engagement rate ranges.
- Published date and duration ranges.
- All, commerce, ad, or organic media type.
- Keyword include or exclude on the description and hashtags.
- Product category paths when they exist.
Step 4: Compare reach and efficiency together
Sorting by views answers “what got seen?” Sorting by engagement rate answers “what got a response relative to its reach?” The two questions can produce different winners.
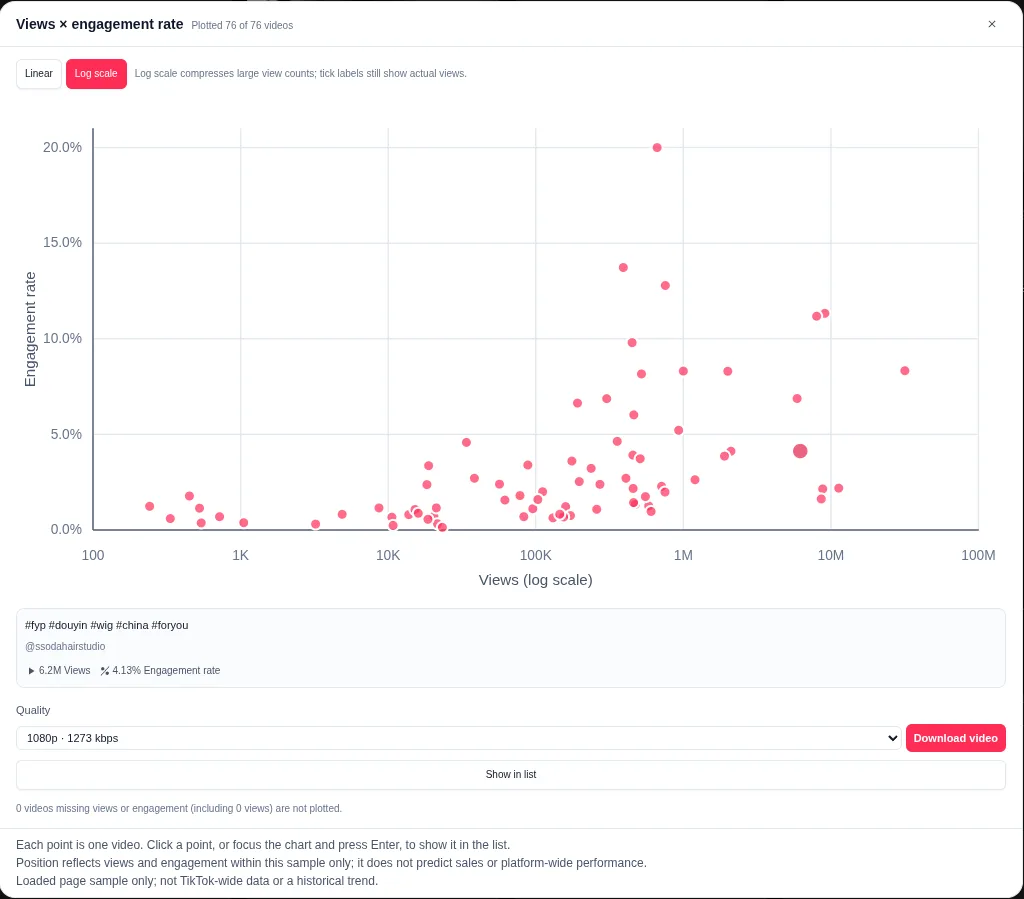
Use the Top 10 view for a quick ranking by views, likes, saves, or engagement rate. Use the scatter view to see both dimensions at once. A video in the upper-right area of the scatter has both high views and high engagement within the sample. A video with a high rate but low views may be an interesting format test rather than a broad hit.
Step 5: Verify the outlier before you act on it
An outlier deserves a second look. Check:
- Date. Is the video recent, or is it an old post that happens to be in the loaded sample?
- Duration. A short video and a long video may have different engagement patterns.
- Commerce or ad status. A labeled ad or product video may have different distribution or intent.
- Product anchors. Does the video actually attach a product, and does the product data look complete?
- Missing fields. Is the engagement rate based on a complete set of interaction counts?
- Sample position. Was the video loaded early, late, or through auto-load? The sample definition matters.
- Reach size. A 60% engagement rate on 1,000 views is not the same finding as 6% on 100,000.
What “high-performing” does not prove
A high view count does not prove sales. A high engagement rate does not prove purchase intent. A Top 10 position does not prove that a format will work again. TokGrid does not estimate revenue, sales, virality, or audience quality, and it does not have platform-wide data.
It is also not a complete history. The list contains cards the page rendered. A creator may have many more videos that were never loaded. Use language such as “the top loaded videos in this sample,” not “the creator’s best videos.”
A practical outlier workflow
- Choose the page type and open it.
- Load a sample and record the count.
- Apply one quick filter or a numeric range.
- Sort by views; note the top records.
- Sort by engagement rate; note the top records.
- Open the scatter view; identify records that are high on both.
- Open Preview to inspect the candidates in card or list view without losing the current filters and sort.
- Check the context fields for each candidate.
- Compare the candidates with the sample median.
- Save or export the shortlist if you need to review it later.
- State the page, date, filters, sample size, and coverage when you share it.
Common mistakes
- Ranking without a sample definition. A list without a page type and date is not reproducible.
- Using only one metric. Reach and efficiency are different questions.
- Ignoring the denominator. Tiny view counts can produce dramatic rates.
- Treating Top 10 as platform-wide. It is the top of the loaded sample.
- Assuming a labeled ad is organic. Commerce and ad flags are context, not a performance verdict.
- Forgetting missing values. A record with missing fields may be excluded from a ranking for a data reason.
Where to go next
For the full sample workflow, read How to Analyze TikTok Video Performance. To inspect and select candidates without losing filters or sort, read How to Preview, Sort, and Filter TikTok Videos. For the calculation, read How to Calculate TikTok Engagement Rate. To compare a creator’s loaded sample, read How to Research TikTok Competitors. The TikTok Video Analytics feature page lists the filters, rankings, and scatter controls.
The useful outcome is not a dramatic screenshot. It is a shortlist of videos you can explain, with a clear statement of what the sample does and does not support.
A note on scope
This guide describes TokGrid’s behavior on public TikTok pages. Page data is processed locally; the extension does not promise complete account histories, platform-wide statistics, sales figures, or access to non-public content.