
Video analytics
TikTok Video Analytics
Turn the public videos already loaded on a TikTok page into a filterable list, then review performance, engagement, and content context without leaving the browser.
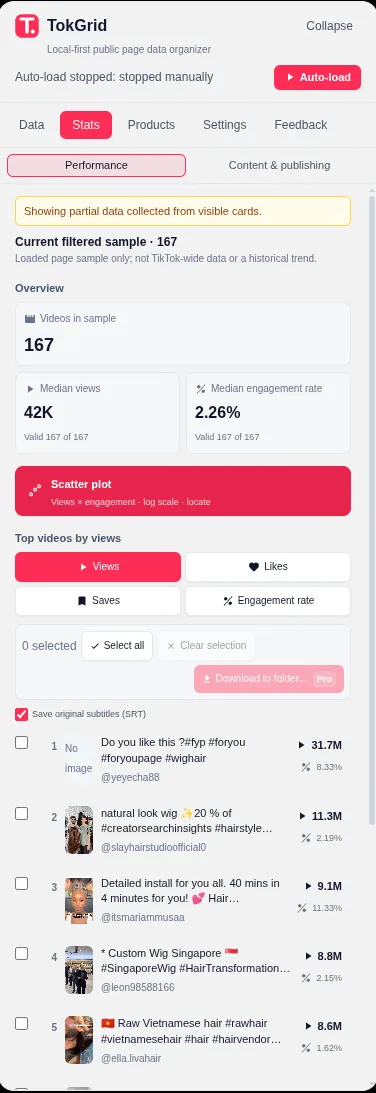
Sample overview
See how many videos are in the current filtered sample and how many records have a valid value for each metric.
Rankings and distribution
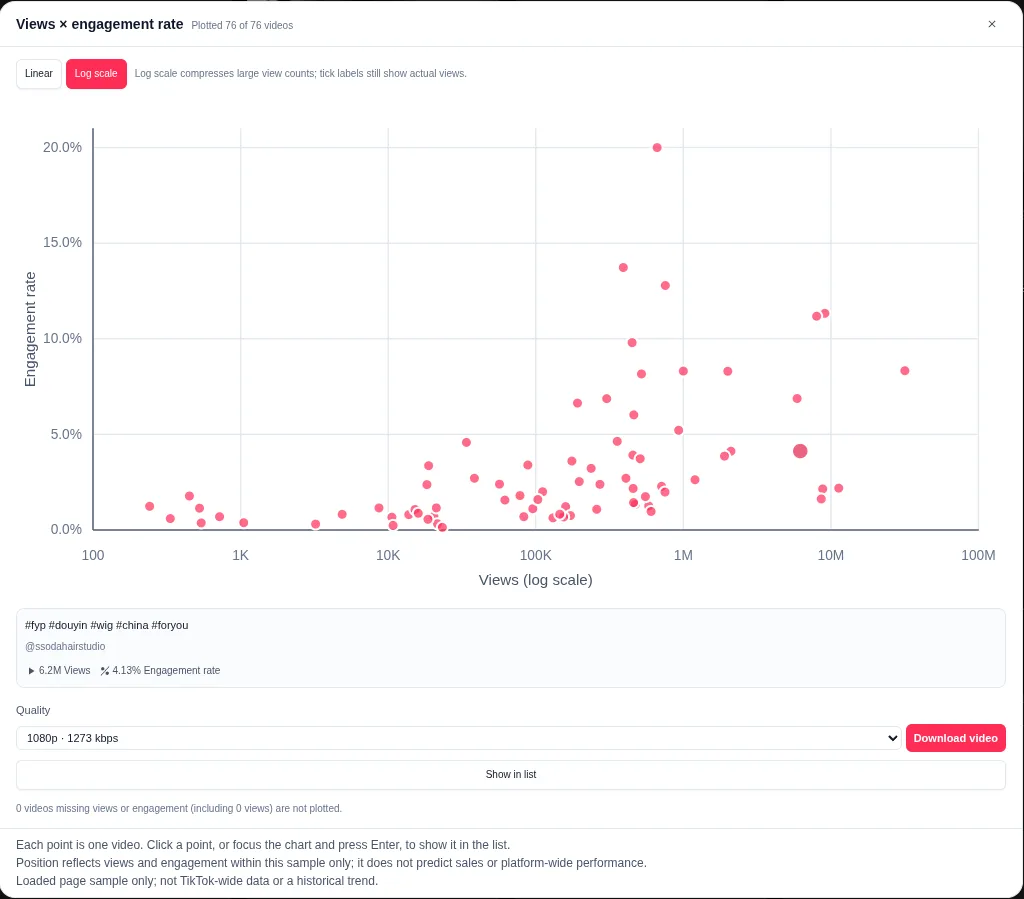
Use Top 10 rankings, a views-by-engagement scatter, publishing frequency, duration distribution, and engagement composition.
Page-level context
Review the values alongside author, product, commerce/ad, and content fields from the same page.
What you can review
The metrics the page actually exposes.
TokGrid does not invent missing fields. If a video does not expose a value, it is shown as missing and excluded from calculations that need it.
| Field | What it means |
|---|---|
| Views | Play count from the available page data. |
| Likes | Digg count where the page exposes it. |
| Comments | Comment count from the loaded video data. |
| Shares | Share count from the loaded video data. |
| Saves | Collect count where available. |
| Engagement rate | (likes + comments + shares + saves) / views × 100. |
| Author context | Follower count, total likes, and the author’s median views on the current page when enough videos are available. |
| Content context | Published time, duration, language, hashtags, music, commerce/ad flags, and product anchors. |
Engagement rate is a TokGrid calculation, not a TikTok official metric. When views are zero or missing, no rate is shown.
Filter and sort
Narrow the sample before you interpret it.
Filters apply to the loaded list. A filtered sample is still a sample, not a new dataset from TikTok.
| Control | Options |
|---|---|
| Numeric ranges | Views, likes, comments, saves, and engagement rate. |
| Time and duration | Published date range and video duration range. |
| Media type | All, commerce, ad, or organic. |
| Keywords | Include or exclude text in the description or hashtags. |
| Category | Filter by a product category path when product data exists. |
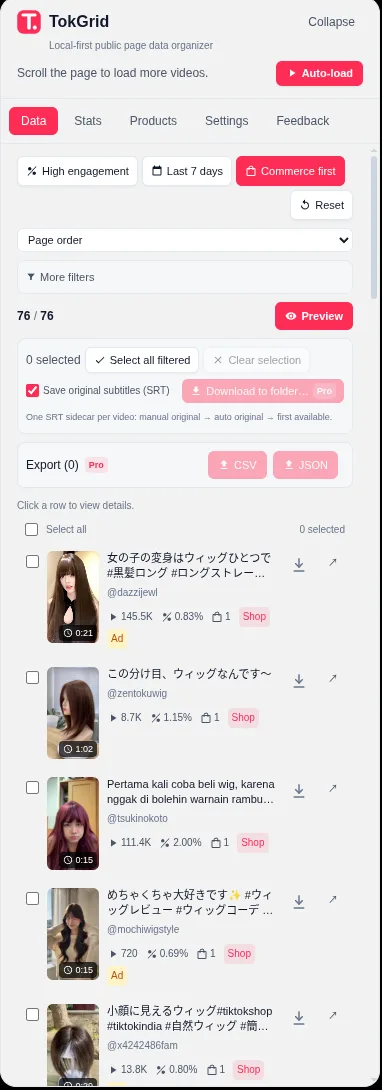
| Quick actions | High engagement, last 7 days, and commerce-first. |
| Sorting | Views, likes, comments, shares, saves, engagement rate, published time, or duration. |
Preview opens the same filtered and sorted list in Cards or List view. Filters and sorting stay in sync, so you can inspect covers, read rows, and make a selection without losing context. Read the preview guide.
Understand the sample
Medians, coverage, and rankings you can explain.
The Stats tab separates the current sample from the platform. It shows how many records are included and how many had a usable value for each calculation.
- Median views and median engagement rate for the filtered sample.
- Valid coverage counts so a median is not mistaken for a complete data set.
- Top 10 by views, likes, saves, or engagement rate.
- Scatter view for videos with both valid views and engagement rate.
- Publishing frequency, duration distribution, and engagement composition.
Auto-load
Ask the page for more, without pretending it is complete.
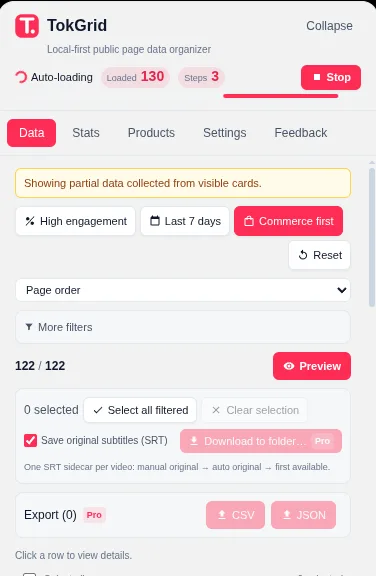
On supported list pages, auto-load scrolls through the viewport to trigger the page’s own loading behavior. You can stop it at any time.
- 1.Open a user profile, search, hashtag, Explore, or music-list page.
- 2.Start auto-load from the panel. It scrolls by viewport and lets the page load its own cards.
- 3.Stop manually, or let it stop when there are no new items, the page changes, the tab is hidden, a dialog opens, or a limit is reached.
- 4.Review the updated sample. It may increase page network and resource usage, and it does not guarantee a complete list.
Known caps: 30 attempts, 120 seconds, or 1,000 items. Login walls, rate limits, and pages that stop returning new cards will end the run early.
Limits
What this page cannot tell you.
Use these boundaries when you share findings with a team or client.
The sample only contains cards the page has rendered. Auto-load is best-effort, not a complete-history guarantee.
Metrics are a page snapshot. TokGrid does not refresh counts in the background or generate historical trends.
The analytics are not platform-wide statistics and cannot be used to infer TikTok-wide performance.
Missing metric values are excluded from medians, rankings, and distributions. A partial interaction record can still produce an engagement rate; check the fields behind it.
Product and subtitle fields may be missing when the page does not expose them.
TokGrid does not estimate sales, revenue, virality, or commercial outcomes.
FAQ
Video analytics questions.
Is the engagement rate a TikTok official metric?
No. TokGrid calculates engagement rate from the page fields: (likes + comments + shares + saves) divided by views, multiplied by 100. When views are zero or missing, no rate is shown. If all four interaction counters are missing, no rate is shown; if only some are missing, the missing counters count as zero.
Does TokGrid show every video from an account?
No. It only processes cards that are rendered in the page. Auto-load can request more cards on supported list pages, but it does not guarantee a complete history and may stop when the page stops returning new items.
Are the statistics live TikTok data?
The metrics are a snapshot of the fields available when the page was read. The extension does not continuously refresh counts in the background. Reload the page or rescan to update the sample.
What do the medians and coverage numbers mean?
Medians describe the current filtered sample and are less sensitive to extreme values than an average. Coverage shows how many records had a valid value for that metric. Missing values do not participate and are not treated as zero.
Can TokGrid predict sales or virality?
No. It describes the visible sample and does not forecast sales, revenue, virality, or platform-wide performance. A high view count or engagement rate is not proof of commercial results.
Guides
Go deeper
How to Analyze TikTok Creator Content
Review a creator’s loaded public videos with medians, coverage, posting frequency, duration, engagement composition, and a content-audit workflow.
How to Analyze TikTok Video Performance
A practical workflow for reviewing the public TikTok videos already loaded on a page, using filters, medians, coverage, and limits you can explain.
TokGrid
Review the sample on the page you are already viewing.
Install TokGrid and open a supported public TikTok page. Core analytics and filters are free.